In manufacturing, data analytics is essential for optimizing processes, improving quality, and increasing efficiency. Four main types of analytics turn data into strategic insights: descriptive, diagnostic, predictive, and prescriptive.
Descriptive analysis identifies patterns in the past, providing a clear view of the state of production. For example, factories use it to monitor performance, detect machine failures, and evaluate production lines.
Diagnostic analysis seeks to understand why something happened, identifying root causes of problems. If there are delays on an assembly line, this analysis can point out if the failure comes from inadequate machinery, material supply, or training.
Predictive analytics uses statistical models and machine learning to anticipate future events. It can predict product demand, equipment lifespan, and maintenance needs. Thus, companies avoid unexpected failures, ensuring continuous operations.
Prescriptive analytics recommends actions to optimize processes. If predictive analytics indicate a risk of failure in a machine, prescriptive analytics suggest preventative maintenance or replacement of parts to avoid unexpected downtime.
In addition to these, exploratory data analysis (AED) uses graphical and statistical techniques to identify patterns and anomalies, being a preliminary stage of descriptive and diagnostic analysis. Explanatory analysis, on the other hand , confirms theories and explains observed patterns, helping to validate hypotheses and communicate results. These approaches make manufacturing more efficient and strategic, reducing costs and improving quality.
Exploratory Data Analysis: Unlocking Answers in the Industry
The term “Exploratory Data Analysis” was introduced by John W. Tukey in the 1970s. With the advent of Big Data, its application in industry has become more present in the last two decades, resulting in a prominent phase for data analysis.
Exploratory Data Analysis (AED) helps determine the best way to manipulate the information collected to obtain the necessary answers in each case. This makes it easier for data scientists to discover patterns, identify anomalies, test hypotheses, or verify assumptions. It is used to explore what data can reveal beyond its formal modeling, as well as to understand the variables of the set and their relationships.
The steps for the application of AED in industry are:
- Data collection and cleaning: Data is collected directly from machines or industrial processes. After that, before starting the analysis, it is important to clean it up, removing missing values, treating outliers, and correcting possible errors. This process ensures the accuracy of the analysis;
- Variable exploration: Understanding the characteristics of variables, such as the distribution, central tendency, and dispersion of data. This is done through descriptive statistics such as mean, median, mode, and standard deviation;
- Identification of outliers: Outliers are extreme or unusual values that distort analysis and results. The EDA allows you to identify whether they should be removed, treated or maintained, depending on the context of the plant and the purpose of the analysis;
- Correlation analysis: By performing the AED, it is possible to observe the relationship between the variables and identify correlations that can be useful in the construction of predictive models. This information can provide important insights when developing new strategies;
- Visualization of results: From this analysis model, it is possible to create a graphical visualization of the data, which is more accessible and easier to interpret. Graphs such as histograms, scatter plots, and boxplots can reveal patterns and trends that were previously hidden;

Different Exploration Techniques
There are 4 main types of AED:
- Non-graphical univariate: It is the simplest form of data analysis, as it analyzes one variable at a time to understand its distribution and identify patterns or anomalies. It does not deal with causes or relationships, and its main purpose is to describe the data and monitor its behavior;
- Non-graphical multivariate: Analysis of two or more variables together to understand their complex relationships. Non-graphical AED techniques usually show the relationships between variables by cross-referencing tables or statistics;
- Graphical univariate: Non-graphical methods do not provide a complete picture of the data, so graphical methods are required. Common types of univariate charts include histograms, box plots, and stem or leaf charts;
- Graphical multivariate: Multivariate data uses graphs to display relationships between two or more data sets. The most commonly used type is the clustered bar chart or bar chart where each group of bars represents a value of one variable, and each bar within the group represents a value of the other variable;
It is also possible to use statistical and visualization techniques, as a form of flexible and open exploration that allows data scientists to delve deeper into the data without preconceived notions. Some examples are:
- Descriptive Statistics: Involves calculating measures of central tendency (such as mean), dispersion (amplitude, variance, standard deviation), and shape (asymmetry, kurtosis) for each variable in the data set;
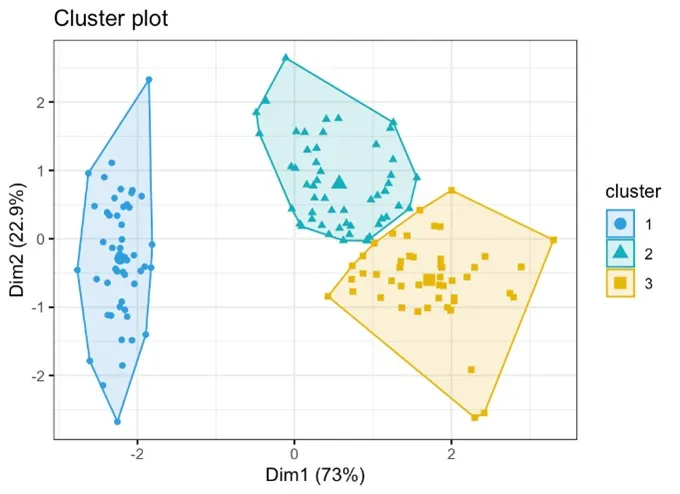
- Clustering: Clustering techniques such as K-means clustering, hierarchical clustering, and DBSCAN are used to cluster similar data points;

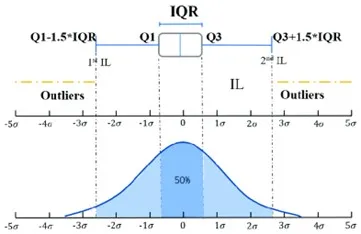
- Outlier detection: techniques such as Z-score and IQR method are used to detect outliers in the data;

Explanatory Data Analysis: Explanation of the data found
Explanatory data analysis is concerned with making inferences from the data, with the aim of explaining the patterns of the data after hypothesis testing. It happens when the data scientist identifies a specific issue that needs to be shown to the public. In summary, this type of analysis is a statistical approach that involves explaining the insights identified about a data set. In the context of industry, it is used to interpret data and provide new insights, which help improve performance, efficiency, and productivity.
This process occurs after Exploratory Data Analysis, and uses methods of visualization, statistics, and data transformation to explain the central characteristics found. In this explanatory phase, you can use a variety of techniques to clarify how the input variables (or traits) are related to your setpoint variable. They are:
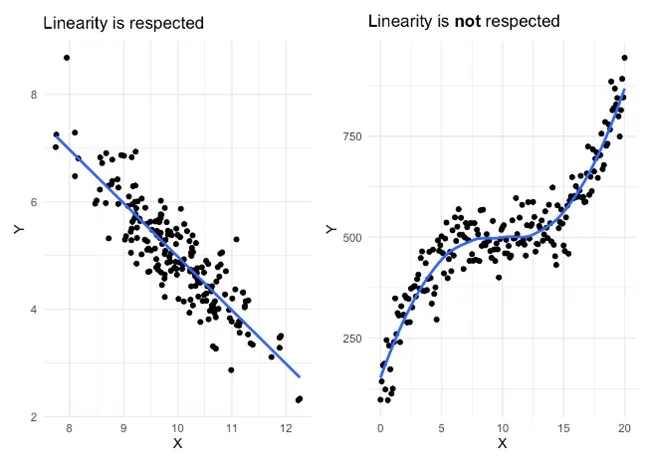
- Regression analysis: It is used to model the relationship between a dependent variable and one or more independent variables. It is useful to understand what factors influence the outcome of a process;

- Time Series Analysis: It is used to analyze data collected over time, such as production rates or quality measurements;
- Pareto Analysis: This technique is used to identify the most significant factors in a data set;
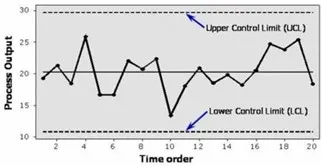
- Statistical Process Control (SPC): SPC methods such as attribute and variable chart, individual and moving interval, execution and pre-control are used to monitor and explain the manufacturing process;

The process of hypothesis testing and outcome measurement may also involve statistical significance (indicating whether findings are reliable or the work of chance). In addition, the size of the effect (the magnitude of the difference or relationship) is another important measure in the explanatory analysis.
Exploratory and Explanatory: Analyses that are present in several industries
The application of both analysis techniques is widely used in the industry, and their positive impact can vary according to the segment. For example, in the automotive industry, exploratory data analysis can be applied to monitor the health of equipment and predict failures. Explanatory, on the other hand, is used to identify the impact of different assembly line configurations on vehicle defect rates.
In the food and beverage industry, exploratory data analysis can identify variations in ingredient consistency. Explanatory, on the other hand, is able to explain the relationship between processing parameters (such as temperature, mixing speed) and quality of the final product.
Lastly, in electronics manufacturing, exploratory data analysis allows you to visualize component failure rates over time to identify trends. And explanatory helps to understand how variations in environmental conditions (such as humidity and temperature) affect the quality of the weld.
As seen, these two methods of data analysis play a crucial role in the industry as they provide insights that aid in process optimization. From them, the data scientist can identify patterns and contribute to the productivity and strategic management of the line. Exploratory analysis helps in understanding and visualizing data, while explanatory analysis explains interactions between variables and tests hypotheses. Together, these approaches are part of a digitalization process that is constantly growing, and help to realize the so-called smart industries.
Learn more about ST-One.