Na manufatura, a análise de dados é essencial para otimizar processos, melhorar a qualidade e aumentar a eficiência. Quatro tipos principais de análise transformam dados em insights estratégicos: descritiva, diagnóstica, preditiva e prescritiva.
A análise descritiva identifica padrões no passado, fornecendo uma visão clara do estado da produção. Por exemplo, fábricas a utilizam para monitorar desempenho, detectar falhas em máquinas e avaliar linhas de produção.
A análise diagnóstica busca entender por que algo aconteceu, identificando causas raiz de problemas. Se houver atrasos em uma linha de montagem, essa análise pode apontar se a falha vem de máquinas, fornecimento de materiais ou treinamento inadequado.
A análise preditiva usa modelos estatísticos e machine learning para antecipar eventos futuros. Ela pode prever a demanda de produtos, o tempo de vida útil de equipamentos e a necessidade de manutenção. Assim, empresas evitam falhas inesperadas, garantindo operações contínuas.
A análise prescritiva recomenda ações para otimizar processos. Se a análise preditiva indicar risco de falha em uma máquina, a prescritiva sugere manutenção preventiva ou substituição de peças para evitar paradas inesperadas.
Além dessas, a análise exploratória de dados (AED) usa técnicas gráficas e estatísticas para identificar padrões e anomalias, sendo uma etapa preliminar das análises descritiva e diagnóstica. Já a análise explanatória confirma teorias e explica padrões observados, auxiliando na validação de hipóteses e comunicação de resultados. Essas abordagens tornam a manufatura mais eficiente e estratégica, reduzindo custos e melhorando a qualidade.
Análise exploratória de dados: desbloqueando respostas na indústria
O termo “Análise Exploratória de Dados” foi introduzido por John W. Tukey, na década de 1970. Com o advento do Big Data, sua aplicação na indústria se tornou mais presente nas últimas duas décadas, resultando em uma fase de destaque para análise de dados.
A Análise Exploratória de Dados (AED) ajuda a determinar a melhor maneira de manipular as informações coletadas para obter as respostas necessárias em cada caso. Isso facilita para os cientistas de dados descobrirem padrões, identificar anomalias, testar hipóteses ou verificar suposições. Ela é usada para explorar o que dados podem revelar além de sua modelagem formal, além de compreender as variáveis do conjunto e suas relações.
As etapas para aplicação de AED na indústria são:
- Coleta e limpeza dos dados: Os dados são coletados diretamente das máquinas ou dos processos industriais. Após isso, antes de iniciar a análise, é importante realizar sua limpeza, removendo valores ausentes, tratando outliers e corrigindo possíveis erros. Esse processo garante a precisão da análise;
- Exploração das variáveis: Compreensão das características das variáveis, como a distribuição, a tendência central e a dispersão dos dados. Isso é feito através de estatísticas descritivas como média, mediana, moda e desvio padrão;
- Identificação dos outliers: Os outliers são valores extremos ou incomuns que distorcem a análise e os resultados. A AED permite identificar se estes devem ser removidos, tratados ou mantidos, dependendo do contexto da fábrica e do objetivo da análise;
- Análise de correlação: Ao fazer a AED, é possível observação a relação entre as variáveis e identificar correlações que podem ser úteis na construção de modelos preditivos. Essas informações podem fornecer insights importantes na hora do desenvolvimento de novas estratégias;
- Visualização dos resultados: A partir desse modelo de análise é possível criar visualização gráfica dos dados, que são mais acessíveis e fáceis de interpretar. Gráficos como histogramas, de dispersão e boxplots podem revelar padrões e tendências que até então estavam ocultas;

Diferentes técnicas de Análise Exploratória
Existem 4 tipos de principais de AED:
- Univariada não gráfica: É a forma mais simples de análise dados, pois analisa uma variável de cada vez para entender sua distribuição e identificar padrões ou anomalias. Ela não lida com causas ou relações, e seu principal objetivo é descrever os dados e monitorar seu comportamento;
- Multivariada não gráfica: Análise de duas ou mais variáveis juntas para entender suas relações complexas. Técnicas de AED não gráficas geralmente mostram as relações entre as variáveis por meio de cruzamento de tabelas ou estatísticas;
- Univariada gráfica: Os métodos não gráficos não fornecem uma imagem completa dos dados, então métodos gráficos são necessários. Os tipos comuns de gráficos univariados incluem histogramas, box plots e gráficos de caules ou folhas;
- Multivariada gráfica: os dados multivariados usam gráficos para exibir relações entre dois ou mais conjuntos de dados. O tipo mais usado é o gráfico de barras agrupadas ou gráfico de barras onde cada grupo de barras representa um valor de uma variável, e cada barra dentro do grupo representa um valor da outra variável;
Também, é possível utilizar técnicas de estatística e visualização, como forma de exploração flexível e aberta que permite aos cientistas de dados se aprofundarem nos dados sem noções preconcebidas. Alguns exemplos são:
- Estatística Descritiva: Envolve o cálculo de medidas de tendência central (como média), dispersão (amplitude, variância, desvio padrão) e forma (assimetria, curtose) para cada variável no conjunto de dados;
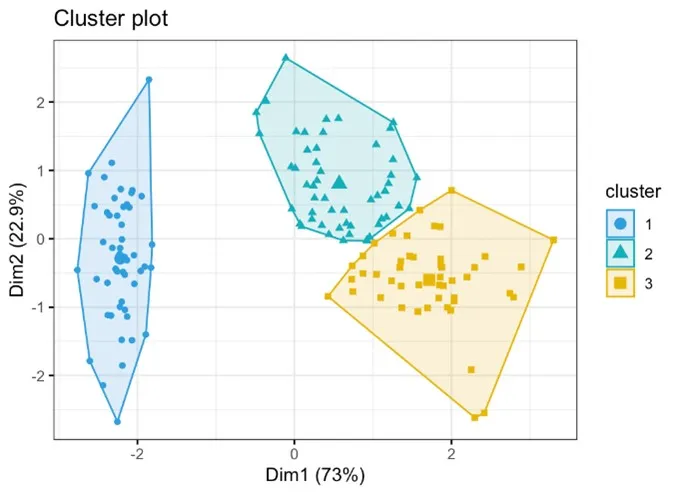
- Clustering: Técnicas de clustering, como agrupamento K-means, clustering hierárquico e DBSCAN, são usadas para agrupar pontos de dados semelhantes;
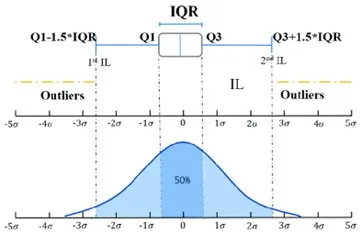
- Detecção de outlier: técnicas como Z-score e método IQR são usadas para detectar outliers nos dados;
Análise Explanatória de dados: Explicação dos dados encontrados
A análise explanatória de dados se preocupa em fazer inferências a partir dos dados, com o objetivo de explicar os padrões dos dados após o teste de hipóteses. Ela acontece quando o cientista de dados identifica uma questão específica que necessita ser mostrada ao público. Em síntese, esse tipo de análise é uma abordagem estatística que envolve explicar os insights identificados sobre um conjunto de dados. No contexto da indústria, é usada para interpretar dados e fornecer novas ideias, que ajudam a melhorar o desempenho, a eficiência e a produtividade.
Esse processo ocorre após a Análise Exploratória de Dados, e utiliza métodos de visualização, estatística e transformação de dados para explicar as características centrais encontradas. Nessa fase explanatória, é possível usar diversas técnicas para esclarecer como as variáveis de entrada (ou características) estão relacionadas à sua variável de saída (setpoint). São elas:
- Análise de regressão: É usada para modelar a relação entre uma variável dependente e uma ou mais variáveis independentes. É útil para entender quais fatores influenciam o resultado de um processo;

- Análise de Séries Temporais: É utilizada para analisar dados coletados ao longo do tempo, como taxas de produção ou medições de qualidade;
- Análise de Pareto: Essa técnica é utilizada para identificar os fatores mais significativos em um conjunto de dados;
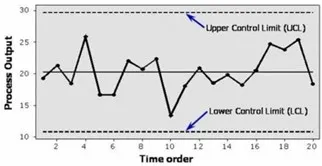
- Controle Estatístico de Processo (CEP): Métodos de CEP como gráfico de atributos e variáveis, de intervalo individual e móvel, de execução e pré-controle são usados para monitorar e explicar o processo de fabricação;
O processo de teste de hipóteses e medição de resultados também pode envolver significância estatística (indicam se os achados são confiáveis ou obra do acaso). Além disso, o tamanho do efeito (a magnitude da diferença ou relação) é outra medida importante na análise explicativa.
Exploratória e Explanatória: Análises que se fazem presente em diversas indústrias
A aplicação de ambas as técnicas de análise é muito utilizada na indústria, e seu impacto positivo pode variar de acordo com o segmento. Por exemplo, na indústria automotiva a análise exploratória de dados pode ser aplicada para monitorar a integridade dos equipamentos e prever falhas. Já a explanatória é usada para identificar o impacto de diferentes configurações de linha de montagem nas taxas de defeitos do veículo.
Na indústria de alimentos e bebidas, a análise exploratória de dados pode identificar variações na consistência do ingrediente. Já a explanatória é capaz de explicar a relação entre os parâmetros de processamento (como temperatura, velocidade de mistura) e qualidade do produto final.
Por último, na fabricação de eletrônicos a análise dados exploratória permite visualizar as taxas de falha de componentes ao longo do tempo para identificar tendências. E a explanatória ajuda a entender como as variações nas condições ambientais (como umidade e temperatura) afetam a qualidade da solda.
Como visto, esses dois métodos de análise de dados desempenham um papel crucial na indústria, pois fornecem insights que auxiliam na otimização de processos. A partir deles, o cientista de dados consegue identificar padrões e contribuir na produtividade e na gestão estratégica da linha. A análise exploratória ajuda na compreensão e visualização dos dados, enquanto a explanatória explica interações entre variáveis e testa hipóteses. Juntas, essas abordagens fazem parte de um processo de digitalização que está em constante crescimento, e ajudam a concretizar as chamadas indústrias inteligentes.
Saiba mais sobre a ST-One.