O Controlador Proporcional Integral Derivativo (PID) foi criado em 1911 pelo inventor Elmer Sperry, inicialmente para a Marinha dos Estados Unidos, com o objetivo de automatizar a direção dos navios e imitar o comportamento de um timoneiro, capaz de compensar e prever variações constantes em alto mar. Anos depois, a engenharia publicou a primeira análise teórica desse controle, descrevendo-o através de uma equação matemática que é a base do cálculo atualmente.
O PID é uma das técnicas de controle mais utilizadas na indústria, garantindo a estabilidade e o desempenho dos processos. Seja na regulação de temperatura, pressão, vazão ou nível, o PID se destaca pela sua versatilidade e eficiência. Cada componente constitui um controle preciso do sistema:
- Controle Proporcional (P): Gera um sinal de saída proporcional ao erro atual, que é a diferença entre o valor desejado (setpoint) e o valor medido (processo). Esta ação ajuda a reduzir o erro, mas não o elimina completamente.
- Controle Integral (I): Produz um sinal de saída proporcional à magnitude e à duração do erro, eliminando assim o erro acumulado.
- Controle Derivativo (D): Considera a taxa de variação do erro, ajudando a prever seu comportamento futuro e aplicar correções mais rápidas, melhorando a estabilidade do sistema e reduzindo a oscilação.
No entanto, a configuração e o monitoramento desses controladores podem ser aprimorados, especialmente através da integração com tecnologias inovadoras como a ciência de dados. A falta de visibilidade sobre o desempenho dos PIDs e a dificuldade em identificar oportunidades de melhoria podem levar a problemas como instabilidade do processo, desperdício de energia e aumento dos custos de manutenção.
Visualização Gráfica do PID: Ajustes Precisos e Eficientes
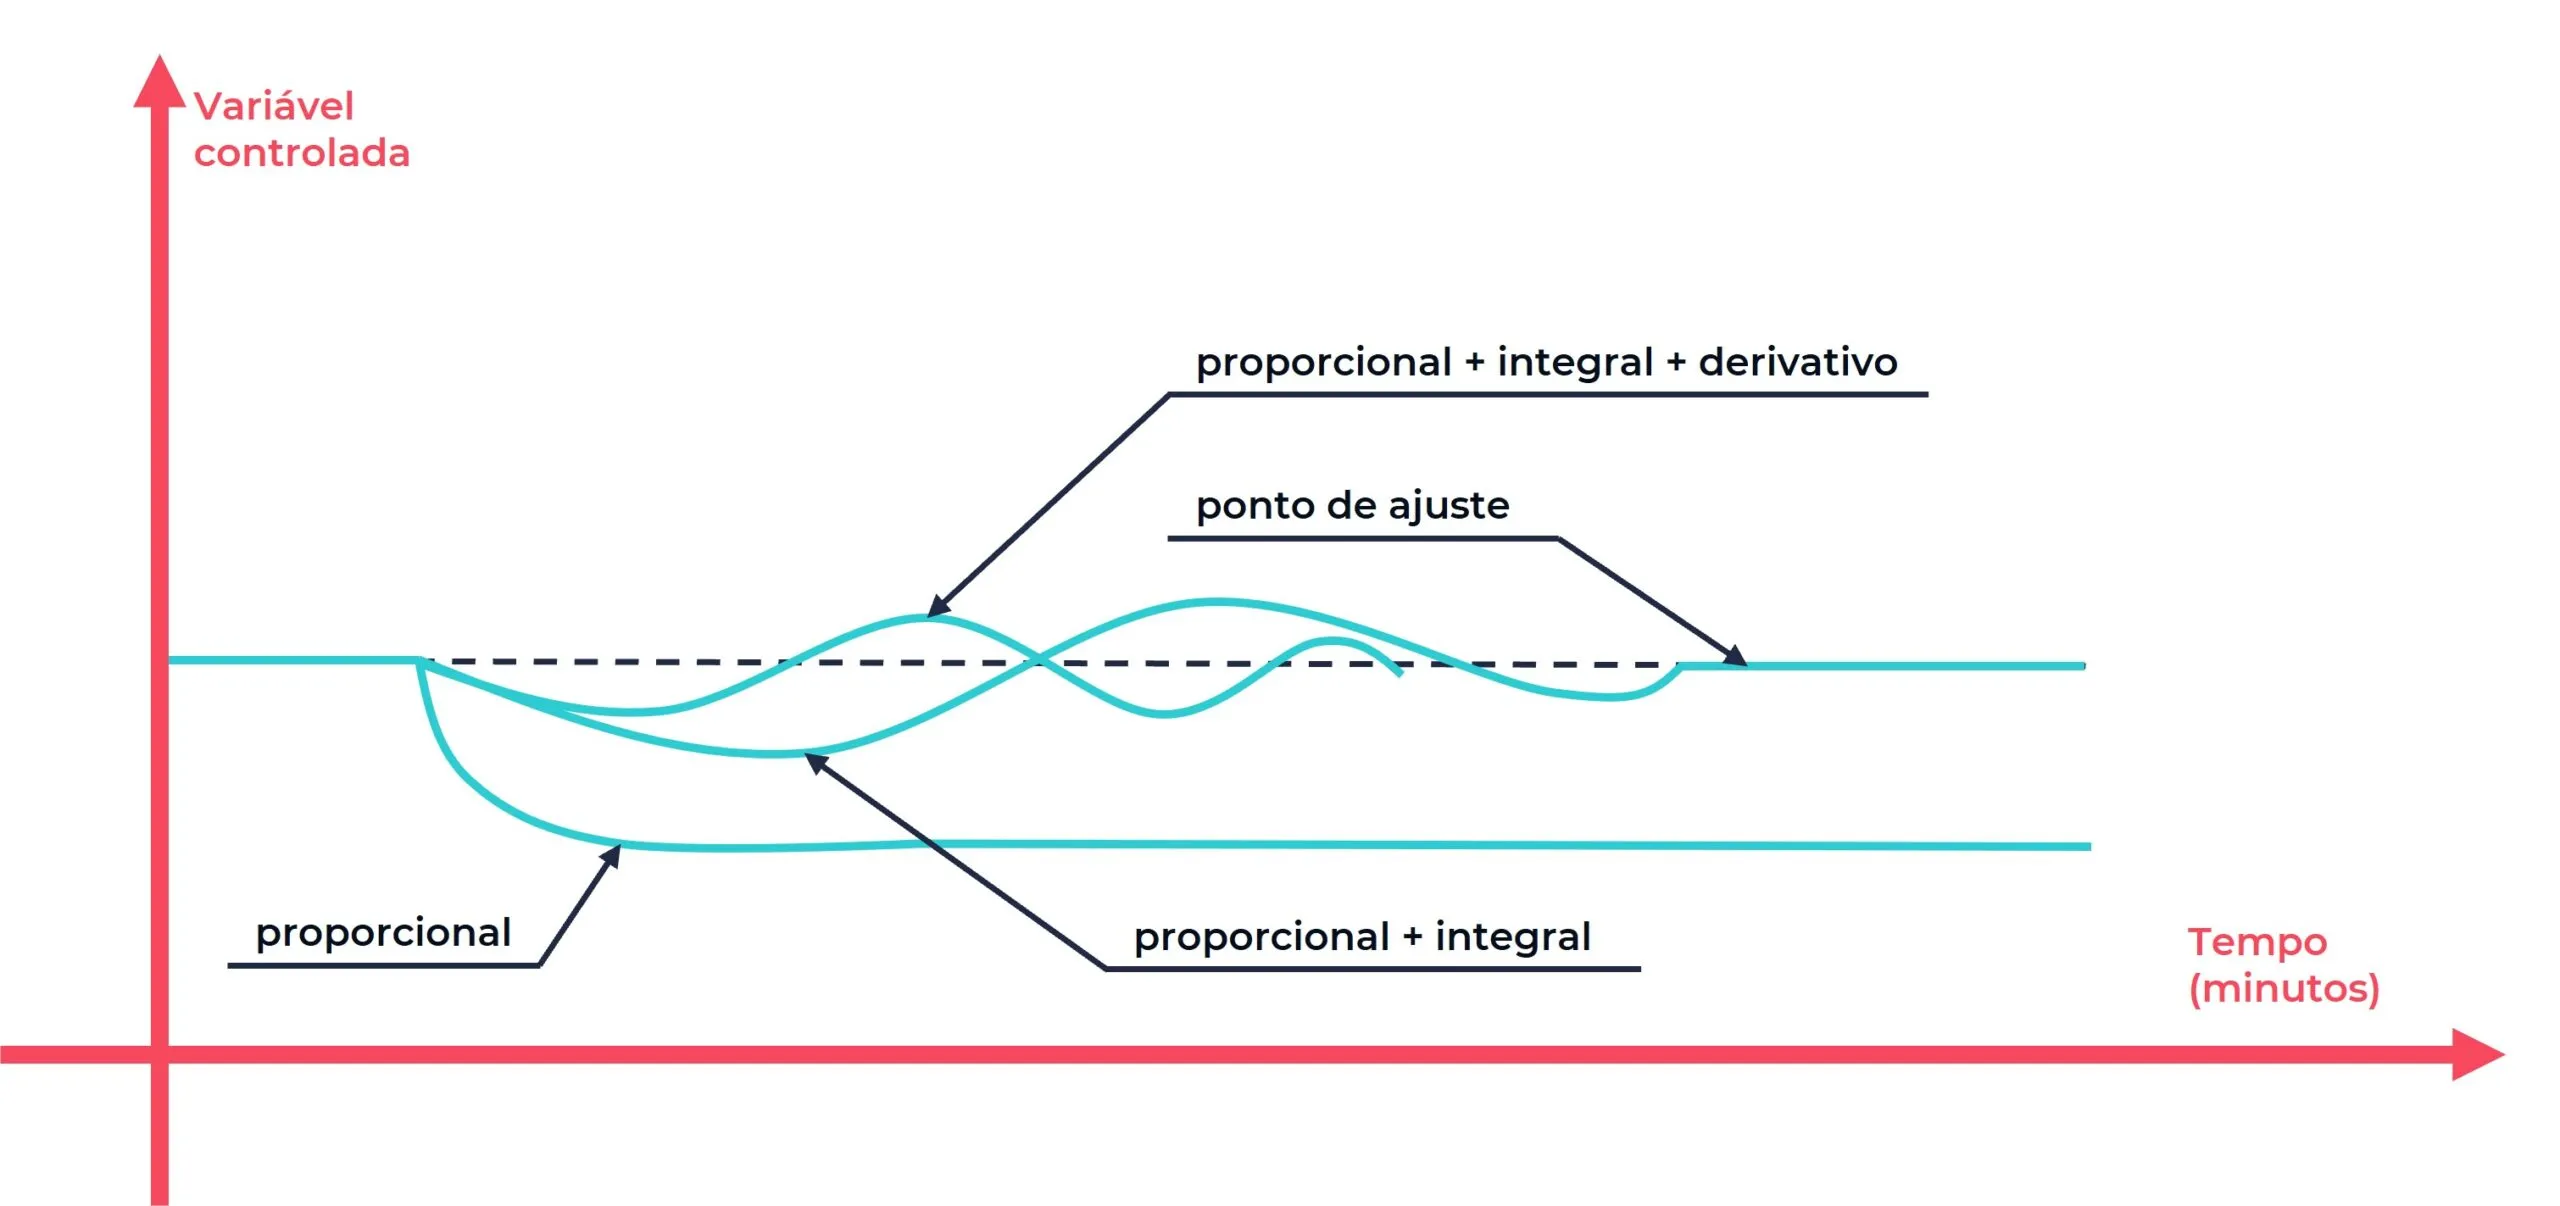
O controlador PID pode ser representado graficamente, exemplificando a resposta do sistema ao longo do tempo. Para isso, ele é construído da seguinte maneira:
- Eixo X: Representa o tempo.
- Eixo Y: Representa o valor da variável que está sendo controlada, como temperatura, pressão, velocidade, etc.
- Linha de Setpoint: Uma linha horizontal constante que representa o valor desejado (setpoint) da variável controlada.
- Linha de Resposta do Sistema: Uma linha curva que mostra como a variável controlada muda ao longo do tempo em resposta ao controle PID. Ela começa no valor inicial da variável controlada e se move até eventualmente se estabilizar no valor de setpoint.
É importante ressaltar que, se a linha de resposta ultrapassar o valor de setpoint, o processo é chamado de “overshoot”. Se cair abaixo do valor de setpoint, é chamado de “undershoot”. O controlador PID é utilizado para minimizar essas variações.
A avaliação do desempenho do PID é feita através de alguns parâmetros:
- Tempo de Subida: O tempo que o sistema leva para atingir o valor de setpoint pela primeira vez.
- Tempo de Acomodação: O tempo que leva para a resposta do sistema se estabilizar no valor de setpoint.
- Erro de Estado Estacionário: A diferença entre o valor de setpoint e o valor final da resposta do sistema.
A figura abaixo ilustra um exemplo gráfico da ação de um controlador PID:
Automação Industrial com Controlador PID
O controlador PID é uma ferramenta essencial na automação industrial. Segundo o Instituto Federal de São Paulo, no estudo “Controlador PID e suas aplicações” (2021), cerca de 97% das aplicações industriais utilizam essa tecnologia. Os controladores PID geralmente estão presentes nos Controladores Lógico-Programáveis (CLPs) e são projetados para tarefas de controle específicas que requerem modulação contínua.
Na indústria, o controlador PID pode ser usado para controlar diversas variáveis, como:
- Controle de temperatura: Em fornos industriais e máquinas em geral, através da leitura de sensores de temperatura.
- Monitoramento do nível de líquidos: Em tanques de armazenamento, ajustando a taxa de fluxo de saída e entrada.
- Controle de pressão: Em sistemas hidráulicos, ajustando a bomba ou válvula de alívio dentro do intervalo desejado.
- Ajuste de velocidade: Em máquinas, configurando a entrega de insumos dentro do parâmetro ideal.
No entanto, a extração de informações de um controlador PID em um CLP apresenta alguns desafios. É necessário estabelecer uma sintonia entre os parâmetros, ou seja, encontrar os valores ideais para as constantes proporcional, integral e derivativa. Isso requer um conhecimento técnico aprofundado dos sistemas e uma calibragem cuidadosa. Também é preciso identificar claramente quais são as variáveis controladas e manipuladas, e detectar erros quando há diferença entre elas e o valor desejado.
Para potencializar e tirar proveito das funcionalidades de um controlador PID, a indústria deve coletar e analisar os dados gerados. Esses dados, provenientes de sensores e dispositivos conectados, ajudam a monitorar o desempenho do sistema, identificar gargalos e otimizar o processo produtivo.
Otimização de PID com Análise de Dados
A utilização de técnicas estatísticas para coletar e analisar dados dos controladores PID em tempo real é uma estratégia poderosa para otimizar o desempenho industrial. Essa análise permite identificar padrões, tendências e anomalias que podem afetar o controle, possibilitando ajustes precisos e eficientes nos parâmetros do PID. Isso garante um controle mais estável, preciso e econômico.
Para avaliar o desempenho dos PIDs, algumas métricas são essenciais. A pontuação de manutenção, por exemplo, indica a necessidade de manutenção preventiva ou corretiva do controlador ou do atuador (como bombas e inversores), com base em indicadores de saturação do controle. Já a pontuação de ajuste avalia a qualidade do ajuste do PID, considerando a estabilidade, a rapidez de resposta e o erro em regime permanente.
A visualização clara e personalizável dos dados é fundamental para uma análise intuitiva. Dashboards customizáveis permitem que operadores e engenheiros monitorem o desempenho dos PIDs em tempo real, identifiquem problemas rapidamente e tomem decisões assertivas. Com ciência de dados, é possível obter uma visão geral do desempenho dos PIDs, acompanhar todos os controladores da planta em um único lugar e identificar problemas através de alertas e notificações automáticas sobre desvios do setpoint, instabilidade do controle ou necessidade de manutenção.
Além disso, a análise comparativa possibilita comparar o desempenho de diferentes controladores, do melhor ao pior, e implementar melhorias. O histórico de dados permite acompanhar a evolução do desempenho dos PIDs ao longo do tempo e avaliar o impacto das ações de otimização.
Integrar a ciência de dados com o controle PID não só melhora a eficiência e a estabilidade dos processos industriais, mas também promove uma gestão mais inteligente e proativa, elevando a produtividade e a sustentabilidade da indústria.
PID e Dados em Tempo Real para uma Indústria Otimizada
Uma indústria que utiliza o controlador PID se destaca positivamente em comparação com uma que não o utiliza. Com o PID, é possível ter um controle mais preciso do erro entre o valor desejado e o valor real de uma variável do sistema. Além disso, uma linha de produção equipada com esse tipo de controlador responde de maneira mais eficaz às mudanças nas condições de produção, ajustando-se rapidamente para manter a variável controlada próxima ao valor desejado.
Como consequência, a indústria como um todo experimenta uma melhora na eficiência operacional, especialmente quando há coleta e análise de dados de um sistema com controlador PID. Isso permite avaliar todos os parâmetros do controlador (proporcional, integral e derivativo) e seu desempenho ao longo do tempo. O acesso a essas informações proporciona uma visão geral da operação, servindo como base para melhorias mais assertivas.
A integração da ciência de dados com o controle PID representa uma verdadeira revolução. Com a união dessas duas ferramentas, é possível obter maior sintonia entre os parâmetros, um controle adaptativo e simulações do comportamento futuro do sistema. Ao fornecer informações precisas e em tempo real sobre o desempenho dos controladores, os dados permitem que as indústrias otimizem seus processos, reduzam custos e aumentem a eficiência.
Saiba mais sobre a ST-One.