 This graph is interactive! (drag the dashed — lines)
The OEE (Overall Equipment Effectiveness) indicator is used in manufacturing industries to assess the operational efficiency of machines and production processes. It originated in Japan in the 1960s as part of the TPM (Total Productive Maintenance) methodology, created by Seiichi Nakajima. This metric is in line with the Lean production philosophy, which focuses on the continuous improvement of processes, allowing its presence in all industrial sectors.
This improvement is directly linked to the adoption of new technologies, such as data science, which allows for a more accurate calculation of OEE. According to the National Confederation of Industry (2022), the Brazilian industry is increasingly digitalized, with the automotive sector standing out.
OEE is calculated from three main factors, namely:
- Availability: Measures the time the machine is actually available to produce in relation to the total planned time. It takes into account planned and unplanned downtime (such as maintenance and failures).
Calculation: Availability = Actual Production Time / Planned Time;
- Performance: Evaluates the actual production speed in relation to the machine’s rated speed. This means that having good performance is synonymous with the equipment operating close to its maximum capacity.
Calculation: Performance = Actual Production / Ideal Production x 100;
- Quality: Measures the ratio of good products to the total products manufactured, considering rejects and rework. More efficient equipment generates fewer defects, improving the overall quality of production.
Calculation: Quality = Good Products / Total Produced X 100;
Exploring OEE with Data Science
The interpretation of the OEE calculation may vary, but, in short, industries seek a number above 85%, considered the world standard. Levels below 60% indicate serious problems in production, and between 60% and 85% point to significant opportunities for improvement.
To achieve this result, it is necessary to collect detailed data on the operation of the machine or production line. Those responsible need to understand what the factory setpoints are , that is, the ideal levels of time, quantity and speed, for example. After that, it is necessary to evaluate the real production metrics, so that it is possible to identify points for improvement. The latter includes the study behind unplanned downtime, low-speed operation, and units that needed rework.
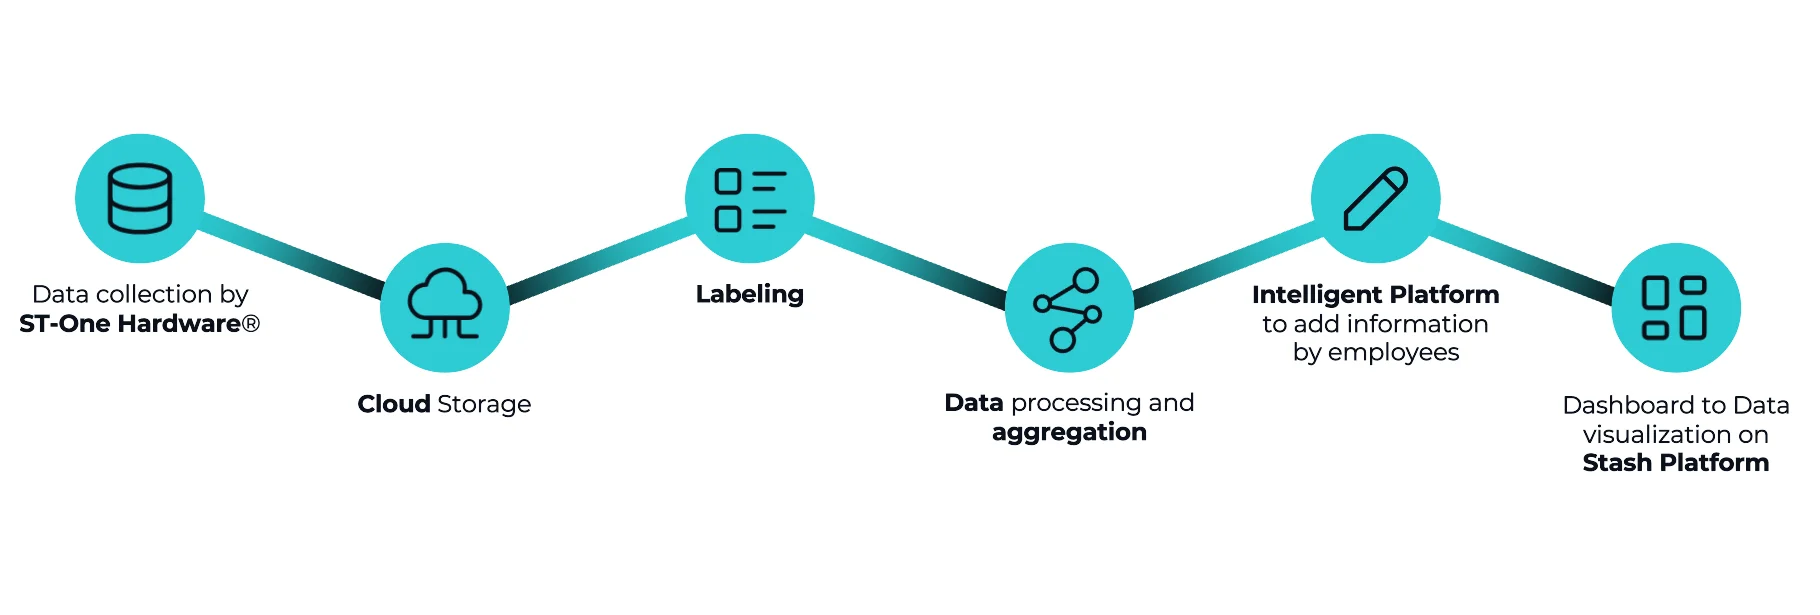
Data collection is the first step in calculating OEE. They are collected by monitoring devices like ST-One® hardware. It records this information simultaneously, and integrates data from various sources such as PLCs (Programmable Logic Controllers) and SCADA (Supervisory Control and Data Acquisition) systems. Then, the collected data must be stored in a database, where each event (start-up, stoppage, etc.) is recorded in a timestamp. In the case of larger structures, data lakes are used to store large volumes of data, structured or unstructured, which can be processed later.
After that, the data is processed and applied to the OEE formula. Here, aggregation algorithms are used to gather the individual data from the machines. The results are presented in dashboards that show OEE in real time, using data visualization libraries or solutions such as Stash Platform™. This intelligent view allows for preventive analysis based on historical data and scheduling alerts if OEE falls below the threshold.
Differentials for the calculation of OEE
There are factors that act as differentials during the OEE calculation process. Among them are aggregation algorithms, which are used to combine or summarize multiple values into a single value. They can have origins in a variety of sources, such as different machines on a production line, or in different time periods. Its goal is to create a representative metric that synthesizes the raw data, making analysis easier and faster, and aiding in decision-making.
“Aggregation is separating a set of data, applying a transformation on top of it and programming it in a cyclical way so that you have a single piece of data. This is widely used in OEE because it is very complex, with several variables, and it is possible to reduce them to a single indicator, which is the percentage of OEE” – Daniel Michalichyn, Head of Development at ST-One
If the OEE calculation is done for a single machine, the formula process is straightforward. Now, if the intention is to calculate the OEE of a production line or a factory, it is necessary to aggregate the individual OEEs of the machines or lines. This can be done in different ways, such as by weighted average, where the contribution of each OEE is weighted by the operating time or quantity:
Weighted OEE=∑(OEE of each machine × Machine Weight)/∑Machine Weight
This approach is most accurate when different machines have different levels of importance or output. The choice of aggregation method depends on the complexity of the system and the desired accuracy. Also, for large volumes of data, the efficiency resulting from the aggregation algorithm is indispensable, because methods like this are computationally more intensive. Finally, it is necessary to highlight the time savings and the greater ease in understanding the data provided by aggregation.
Practical examples of data aggregation in the context of OEE
One of the ways to use aggregation algorithms to calculate OEE is time aggregation. For example, if the intention is to calculate the OEE of a production line throughout the day, it is possible to aggregate each shift or hour. Here, each period has a weight based on the length of the period or the quantity produced.
It is also possible to do aggregation by equipment. In a factory with multiple production lines, the overall OEE can be a weighted average of the OEEs of different lines. In this context, the weight is based on the production volume of each line.
The following is an example of how this would be applied directly to a calculation:
- Aggregation of availability data
Equipment A: Operational Time = 400 min, Scheduled Time = 480 min
Equipment A: 400 / 480 = 83.3%
Equipment B: Operating Time = 350 min, Scheduled Time = 480 min
Equipment B: 350 / 480 = 72.9%
Total Availability= (400+350) / (480+480) = 750 / 960 ≈ 78.1%
- Performance Data Aggregation
Equipment A: Performance = 90%
Equipment B: Performance = 85%
Average Performance = 90+85/2 =87.5%
- Quality data aggregation
Production Line A: Quality = 98%
Production Line B: Quality = 95%
Average Quality = 98+95/2 = 96.5%
- OEE aggregation
Equipment A: 83.3%*90%*98% = 73.47%
Equipment B: 72.9%*85%*95% = 58.86%
OEE Total = (73,47% + 58,86%)/2 = 66,16%
Data aggregation in the context of OEE is a powerful tool for production management, allowing a comprehensive and detailed view of operational performance. By using time aggregation, it is possible to identify variations in efficiency throughout the day, making it easier to identify specific bottlenecks in different shifts. Aggregation by equipment allows you to compare performance between different production lines, highlighting which equipment or processes need improvement.
In addition, combining availability, performance, and quality data into a single OEE indicator provides a consolidated metric that reflects overall production efficiency. This integrated approach not only facilitates strategic decision-making but also fosters a culture of continuous improvement, encouraging optimization and operational excellence.

Challenges in the implementation of OEE in industry
As previously stated, the implementation of OEE in the industry involves many steps. To carry out this flow without problems, the industry must pay attention to some points:
- Data collection: Implementing a system that collects data accurately and consistently can be challenging, especially in operations that involve manual steps;
- Culture: A methodology focused on continuous improvement requires cultural commitment and buy-in at all levels of the organization;
- Interpretation and action: To make full use of OEE measurement it is crucial to interpret the results and act on them to improve the outcome;
- Continuous review: One needs to regularly review the data and strategies to ensure that the plant is operating efficiently and productively;
In addition to the points presented, which deserve attention when calculating the OEE, it is necessary to relate it to other metrics. TEEP (Total Effective Equipment Performance) measures efficiency by considering all available time, including periods outside of scheduled hours. It is calculated by multiplying OEE by usage:
TEEP = OEE X Utilization
If a factory has an OEE of 75% and the utilization of available time is 80%, the TEEP would be:
TEEP = 0.75 X 0.80 = 0.60 or 60%
When talking about productivity metrics, it is necessary to establish their differences. Although related, OEE focuses on equipment effectiveness, while productivity can include factors such as labor and process efficiency.
In addition to the aforementioned challenges, the implementation of OEE in the industry can be enhanced with technologies such as the Internet of Things (IoT) and data analytics. These allow for more accurate and real-time data collection, making it easier to identify patterns and anomalies. The integration of OEE with management systems (ERP) also provides a holistic view of the operation, aligning the efficiency of equipment with the company’s strategic objectives.
Finally, comparing OEE to industry benchmarks can help identify opportunities for improvement and set realistic and challenging goals. With these complementary approaches, the industry can not only overcome the challenges of implementing OEE, but also achieve higher levels of efficiency and competitiveness. Learn more about ST-One.