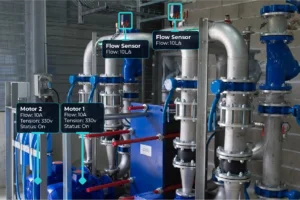
Collecting data on an ongoing basis is no longer a technological barrier. Currently, IoT devices, sensors, and systems for storing data in an organized way are already more accessible to all types of industries. According to the Industry Portal, 69% of Brazilian industries already used some type of digital IoT technology in 2022.
In addition to meeting legal requirements, the implementation of a traceability system also brings competitive advantages. With it, it is possible to guarantee not only the quality of the finished product, but also to have more control over the need for recalls in cases of defects caused by external and internal factors to the production environments. According to the Ministry of Justice, in 2017 Brazil broke a record of recalls in consumer products, with the automotive sector being the leader in recalls.
Connecting these technologies with the traceability methodology brings a new way of visualizing. For example, in a sausage production, where it is necessary to use an industrial oven, it is common to have a report of each phase of the cooking process, with data such as:
| Estágio | Lote 1 | Lote 2 |
| 1 | 25 °F | 30 °F |
| 2 | 45 °F | 45 °F |
| 3 | 60 °F | 61 °F |
| 4 | 139 °F | 139 °F |
| 5 | 154 °F | 154 °F |
| 6 | 168 °F | 170 °F |
| 7 | 50 °F | 60 °F |
| 8 | 30 °F | 25 °F |
Analyzing this information graphically, the following behavior is obtained:
In this type of sampling, several important pieces of information are not collected, which can lead to a false sense that the temperature values are behaving as expected. Using a higher sampling rate and a big data system, it is possible to store the complete baking curve, for example:
In this example, you can find possible deviations and compare the batches much more accurately:
In addition to being able to store much more data today, it is also possible to collect data from various other sources and equipment that in the past were called “black box”. Currently, this equipment is already more easily integrated into a data collection structure, allowing a failure of one machine to be correlated with a failure in another. For example, it is possible to quickly diagnose a pause in a production line that occurs within minutes of a compressor room failure.

Intuitive Visualization: Improving Data Traceability
Data traceability, in addition to facilitating production management and error correction, helps to achieve greater accuracy in analysis. This is because this way of visualizing data allows for the collection of more information, improving quality and reducing limitations.
Visualizing and managing a large amount of data is a challenge that, with modern technologies, becomes increasingly easier. With animated graphs, it is possible to gain a new dimension in the analysis, which was previously restricted to two axes (x, y). Now, in addition, it is possible to represent the movement of the variables in these axes over time. For example, it is possible to perform an analysis of torque (y-axis) and angle (x-axis) of tightening more than 13 thousand screws. This movement was carried out over more than 200 days (animation) and can be monitored, as shown in the graph below:
In this same example, it is possible to add more data, such as the ambient temperature of the day or from a measurement system near the location of the squeeze. This data could be represented by the size of each circle, bringing even more information to be explored:
Performance Increase from Data Traceability
By using connection technologies that allow for simplified data collection, it is possible to gain insights that would previously have been hidden. This situation occurs mainly due to the lack of data, a problem that traceability solves. With these tools, analyses and decisions are made in a more assertive and concrete way, always based on information collected directly from the machinery.
Those responsible for these insights are data professionals, who use the data collected to bring new perspectives to the industry. Starting from the total view of the process, scientists are able to make their analyses with the objective of discovering and exploring. Thus, it is possible to understand patterns, identify trends, ensure or improve quality, reduce damage and identify failures directly at the source. The visibility provided by digitalization results in the redefinition of strategies and the implementation of improvements.
Having a data history also contributes to this scenario, mainly through actions that increase productivity. According to the CNI (National Confederation of Industry), this index grew 0.7% in the third quarter of 2023. This reinforces that the implementation of technological solutions helps to unlock results and raise the industry to a new level of productivity.